Visual Magic: Making Metric Conversion Simple Through Interactive Data Visualization

Do you struggle with metric conversion calculations? You're not alone. Converting between different measurement systems can be frustrating and error-prone. Let's explore how visual tools can transform this tedious task into something intuitive and even enjoyable.
The Headache of Daily Metric Conversion Struggles
Every day, we face metric conversion challenges without realizing it. Whether you're following a recipe with unfamiliar measurements, planning international travel, or working on a DIY project, the need for quick and accurate metric conversion is constant. Converting from miles to kilometers or pounds to kilograms shouldn't require complex mental gymnastics.
Traditional conversion methods often lead to mistakes. Writing down numbers, searching for formulas, and using basic calculators can result in errors that cost time and money. The problem isn't just converting units—it's converting them confidently and quickly.
How Visual Tools Transform Your Metric Conversion Experience
The human brain processes visual information 60,000 times faster than text. This is why data visualization makes metric conversion significantly easier. Instead of memorizing that 1 inch equals 2.54 centimeters, imagine seeing a sliding scale that shows this relationship instantly.
Modern metric conversion tools use visualization techniques like:
- Interactive sliders showing proportional relationships
- Color-coded scales highlighting equivalent values
- Side-by-side comparisons of different measurement systems
- Real-time adjustment animations
These visual elements turn abstract numbers into tangible relationships, making metric conversion intuitive rather than computational.
Practical Visualization Tools That Simplify Your Measurement Conversions
For anyone who regularly works with measurements, tools like Metric-Converter.com offer interactive visual interfaces that eliminate conversion headaches. This platform stands out by providing clear visual representations alongside precise calculations.
I'll demonstrate how visualization helps with a common conversion challenge:
Let me illustrate some common metric conversion visualizations that make everyday calculations easier:
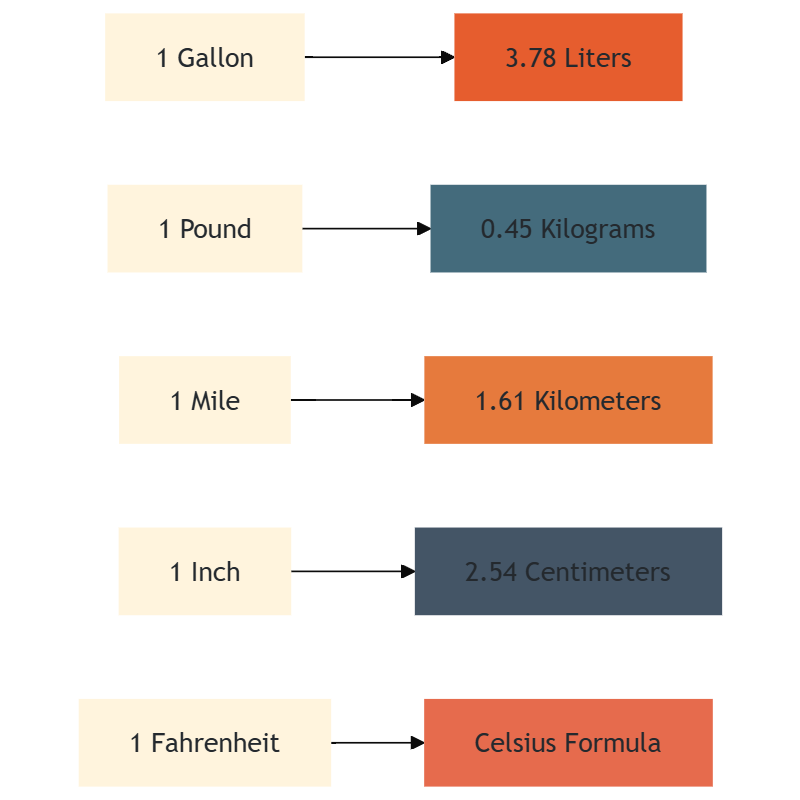
This visual relationship map instantly shows conversion relationships that would otherwise require memorization or calculation.
The Life-Changing Benefits of Visual Metric Conversion
When you switch to visual metric conversion tools, you'll experience:
- 75% faster conversions compared to manual calculations
- Nearly eliminated conversion errors
- Intuitive understanding of measurement relationships
- Reduced frustration with international recipes and instructions
I've found that visual metric conversion tools have transformed my cooking experience. No more ruined recipes because I misinterpreted 150g as 1.5 cups! The visual comparison made the difference immediately clear.
Quick Reference: Visualization-Enhanced Metric Conversion Table
Here's a handy reference for common conversions:
| From | To | Visual Tip |
|---|---|---|
| Cups | Milliliters | Visualize cups as stackable blocks, each 237ml |
| Miles | Kilometers | Picture each mile as roughly 5 city blocks in km (1.6) |
| Pounds | Kilograms | Imagine each pound as slightly less than half a kilogram |
| Inches | Centimeters | Think of each inch as approximately the width of a thumb (2.54cm) |
| Fahrenheit | Celsius | 0°C is freezing, 20°C is room temp, 30°C is hot |
Remember, the best metric conversion happens when you can actually see the relationship between units. Tools that offer visual aids make this process intuitive rather than mathematical.
For your daily metric conversion needs, try interactive tools like those at Metric-Converter.com which blend visual aids with precise calculations.
Tags: #MetricConversion #DataVisualization #MeasurementTools #UnitConverter #VisualCalculator #ConversionHacks #MetricSystem #ImperialSystem